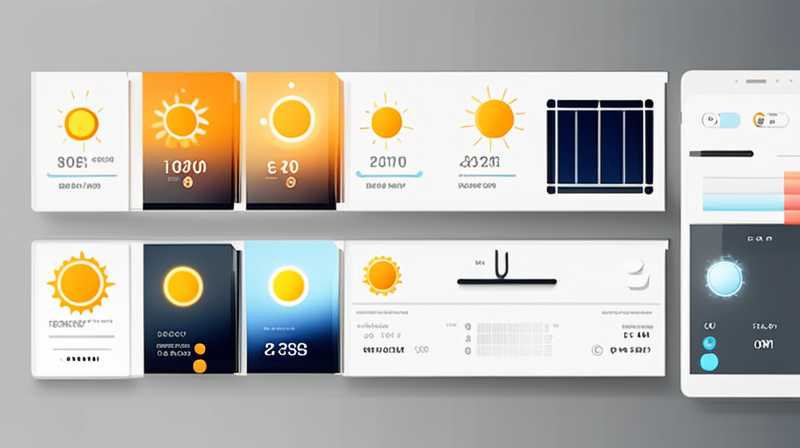
The solar power display provides vital insights into a solar panel system’s performance. 1. It indicates electricity production levels, allowing users to gauge efficiency over time, 2. It monitors energy consumption, showing how much energy is being utilized versus generated, 3. It displays system status, providing alerts and notifications about performance issues, and 4. It offers historical data analysis, enabling comparisons across different time periods. A primary function of these displays is to visualize the real-time generation of energy, which empowers users to understand how much solar power is being produced at any given moment, thus facilitating decisions about energy usage. For example, by recognizing peak production hours, consumers can optimize their consumption to maximize energy efficiency, leading to reduced electricity costs and increased reliance on renewable energy sources.
UNDERSTANDING SOLAR POWER DISPLAYS
In an era where renewable energy is becoming increasingly vital for sustainable development, solar power displays have emerged as indispensable tools for solar panel users. These displays present crucial data in a visually digestible format, allowing homeowners and businesses to make informed energy-related choices. The data can be displayed in various forms, such as graphs or numerical figures, depending on the technology incorporated in the system. As society shifts towards greener energy solutions, understanding how to interpret these displays can lead to a more efficient utilization of solar power resources.
The evolution of solar power displays is driven by advancements in technology that allow for real-time data collection and analysis. With sophisticated sensors and monitoring tools, these systems can relay information on energy production, consumption, environmental conditions, and even the health of the solar panels. Users can leverage this information not only for personal insight but also for broader community awareness, thereby promoting a culture of energy efficiency and environmental responsibility.
TYPES OF DATA DISPLAYED
REAL-TIME ENERGY PRODUCTION
Focusing first on real-time energy production, solar power displays offer a detailed overview of how much energy is being generated at any moment. This information is instrumental for any user. Energy output fluctuates throughout the day, dictated by sunlight intensity, weather conditions, and the angle of sunlight hitting the panels. Users can observe these fluctuations in real-time, enabling them to plan their consumption patterns effectively, such as running energy-intensive devices during peak solar hours to utilize self-generated electricity.
The ability to monitor real-time production can also provide insights into the system’s efficiency. If sudden dips in production are observed, it may prompt users to investigate potential issues with their solar panels, such as dirt accumulation or damage. Additionally, by understanding these dynamics, users can also participate in energy trading markets if available, selling excess energy back to the grid during peak generation periods.
ENERGY CONSUMPTION MONITORING
A crucial aspect of solar power displays is energy consumption monitoring. Users can track how much solar energy is being utilized in real-time, thereby gaining insights into their consumption patterns. This monitoring function allows for the identification of trends over time, and users can determine which activities consume the most energy, providing an opportunity to adjust behaviors for enhanced efficiency.
By understanding energy consumption alongside production, users can maximize the benefits of their solar energy systems. For example, if a household sees that it typically consumes more energy in the evenings but generates most of its power during the day, it may decide to run more devices during daylight hours or invest in battery storage to shift energy use. This critical data enables users to achieve a balance between generation and consumption, optimizing their solar energy utilization.
MONITORING SYSTEM STATUS
PERFORMANCE ALERTS AND DIAGNOSTICS
Incorporating a monitoring system adds a layer of security to solar energy use. Solar power displays can provide system status alerts that notify users about any significant deviations in performance. Performance alerts enable quick responses, allowing users to initiate repairs or maintenance when abnormalities are detected.
For instance, users may receive notifications regarding a drop in energy generation or warnings about performance issues related to inverter functionality. Early detection of these issues can mitigate further damage or costly repairs, as regular monitoring allows for timely interventions. By leveraging this feature of solar power displays, users maintain a high level of system reliability, ensuring ongoing energy production efficiency.
INVERTER HEALTH MONITORING
The inverter is integral to converting the direct current produced by solar panels into usable alternating current for home or business use; hence, monitoring its health is critical. Solar power displays can provide specific data on inverter performance, facilitating maintenance decisions. Real-time health monitoring of the inverter can alert users to potential problems, such as overheating or component failures.
Monitoring the inverter’s status can increase the lifespan of the entire system by allowing users to replace or repair components preemptively before catastrophic failures occur. This proactive maintenance fosters a sense of responsibility toward the entire solar power system and encourages investment in high-quality equipment that supports long-term sustainability efforts.
HISTORICAL DATA ANALYSIS
TRACKING EFFICIENCY OVER TIME
Historical data analysis is one of the more nuanced features of solar power displays, enabling users to track performance and trends over extended periods. This capacity to view past performance provides valuable insights into the effectiveness of the solar system, particularly concerning external factors like seasonal trends and weather patterns.
For example, users can assess whether their solar installation performs consistently throughout the year or if there are significant variations in output. By analyzing these historical trends, users may want to adjust their energy consumption or explore ways to enhance their solar setup. Insight into long-term performance can also be beneficial for financial planning, as users can predict ROI based on historical data.
COMPARATIVE ANALYSIS
Moreover, historical data opens the door to comparative analysis. Users may compare their solar energy production across different years or seasons, understanding better how external factors influence performance. This in-depth analysis fosters informed decision-making regarding upgrades or enhancements, such as investing in additional panels or better technology.
By enabling users to compare and contrast data, solar power displays empower individuals to understand their energy production contextually. Whether through seasonal changes or technology improvements, this emphasis on tracking empowers users to engage effectively with their renewable energy systems.
THE ROLE OF USER INTERFACE IN SOLAR POWER DISPLAYS
VISUAL REPRESENTATION OF DATA
A compelling aspect of solar power displays is their user interface, designed to present complex data in visually engaging formats. Graphs, color-coded indicators, and real-time updates help users absorb critical information without feeling overwhelmed. This visual representation serves to demystify solar energy metrics, allowing even those with limited technical backgrounds to interpret their solar system’s performance.
Color-coded indicators can simplify the monitoring process, signaling positive performance or alerting users to issues. Such intuitive designs encourage regular engagement with the data, fostering informed decision-making and reinforcing the importance of solar energy management.
MOBILE APPLICATIONS AND REMOTE MONITORING
In today’s digital age, many solar power displays come equipped with mobile applications that enable remote monitoring. This feature allows users to check performance metrics from anywhere, providing convenience that matches the demands of modern life. Whether at work, traveling, or simply away from home, users can stay informed about their solar energy system’s status.
Mobile access to data not only increases convenience but also promotes engagement with the solar energy process. Users can quickly identify performance issues and receive alerts directly on their devices, making it easier to take immediate action when needed. This aspect of user interface design aligns with the general trend towards digital solutions in managing energy resources effectively.
THE IMPACT ON ENERGY BEHAVIOR
PROMOTING ENERGY EFFICIENCY
The information provided by solar power displays can significantly influence user behavior regarding energy consumption. By giving users the ability to monitor both production and consumption, these displays pave the way for increased awareness and engagement. As users witness their solar energy generation in real-time, they become more likely to adjust their habits, running appliances during peak energy production times.
This transformation encourages a culture of energy efficiency not only at the individual level but also within the broader community. As users become aware of how their behaviors influence energy consumption, they may begin to share their insights with neighbors and friends, fostering a community-wide commitment to environmental sustainability and responsible energy use.
INFLUENCING RENEWABLE ENERGY ADOPTION
Moreover, the positive experiences of individuals using solar power displays can propel wider adoption of renewable energy solutions. People are more likely to advocate for solar power solutions when they comprehend the technology’s benefits and efficiency. The transparency provided by these displays empowers users to contribute to conversations around renewable energy, advocating for policy changes or community initiatives that support sustainable energy practices.
Sharing data and success stories derived from solar power displays not only urges neighbors to switch to solar but also inspires confidence in these energy solutions. Enhanced community understanding can lead to increased investment in solar technologies, aiding the transition towards a more sustainable energy future.
FREQUENTLY ASKED QUESTIONS
HOW DOES A SOLAR POWER DISPLAY WORK?
A solar power display works by monitoring and recording the performance of a solar energy system. It collects data from various sensors installed on the system components, such as solar panels and inverters. This information is then processed and visually presented in real-time through graphs, numerical readouts, or alerts. Users can view metrics related to energy produced, energy consumed, and system status, allowing them to make informed decisions regarding energy management and maintenance. Some displays also incorporate historical data analysis, enabling users to track performance trends over time and adjust their energy behaviors accordingly.
CAN I MONITOR MY SOLAR POWER SYSTEM REMOTELY?
Yes, many modern solar power systems feature the capability of remote monitoring. This is often facilitated through mobile applications or web-based platforms that connect to the solar power displays. Users can access real-time performance data from their smartphones, tablets, or computers, providing unprecedented convenience in managing their solar energy systems. Remote monitoring allows users to stay updated on their solar production, consumption patterns, and system health even when they are not physically present. This aspect of solar power displays enhances user engagement and ensures quick responses to any potential issues.
HOW CAN I IMPROVE THE PERFORMANCE OF MY SOLAR POWER SYSTEM?
Improving the performance of a solar power system involves several strategic actions. First, regular maintenance is paramount; ensuring that the solar panels are clean and free from debris can significantly enhance energy production. It’s also essential to monitor the inverter’s health and replace any faulty components promptly. Additionally, users can analyze historical data to identify patterns in energy production and consumption, informing better usage practices. For instance, shifting high-energy activities to sunny periods can maximize the use of self-generated electricity. Finally, seeking professional assessments for potential system upgrades or expansions can also optimize overall performance, ensuring a more efficient solar energy setup.
Utilizing solar power displays effectively incorporates technology into sustainable energy usage, allowing users to monitor and modify their behaviors responsibly. As the world shifts towards renewable solutions, these displays enable informed decisions that contribute to both financial savings and ecological mindfulness. Engaging with solar power requires understanding the intricacies showcased on these displays, as they offer comprehensive insights that drive efficiency. Beyond personal benefits, these displays can stimulate community advocacy for renewable energy as users share their experiences, contributing to a larger cultural awareness of sustainable practices. The continuous evolution of solar power technology means that displays will likely become even more sophisticated, providing a greater breadth of data and insights tailored to user needs. Users not only gain immediate benefits but contribute to long-term global sustainability through informed energy practices that align with renewable initiatives. The future of solar energy is bright, and with informed users empowered by solar power displays, the journey towards energy independence and environmental stewardship is more achievable than ever.
Original article by NenPower, If reposted, please credit the source: https://nenpower.com/blog/what-does-the-solar-power-display-show/


