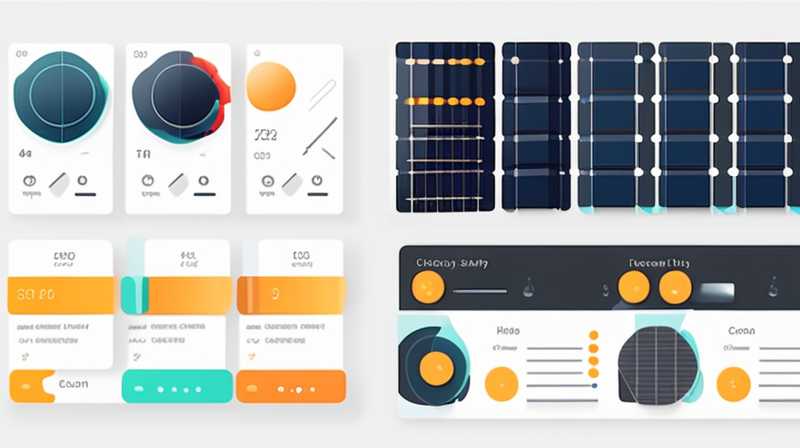
To effectively view solar panel data, one can utilize various tools and methods, including 1. Monitoring Systems, 2. Mobile Applications, 3. Web Portals, and 4. Data Analysis Software. Monitoring systems, typically installed alongside solar panels, provide real-time data by converting solar energy output into easily digestible information. For example, users may access metrics on power generation, system performance, and environmental impact through dedicated display units or online platforms.
Electricity usage and solar output are critical performance indicators for optimizing energy consumption, maximizing efficiency, and forecasting energy demand. Understanding these aspects can help homeowners or businesses address issues promptly, providing peace of mind and savings in energy costs.
This comprehensive approach equips individuals and organizations to make educated energy choices, adapting usage according to solar production and efficiently integrating various energy sources into their consumption portfolios.
1. MONITORING SYSTEMS
Monitoring systems serve as the cornerstone for viewing solar panel data. These systems typically consist of hardware and software components working jointly to provide detailed insights into the performance of solar energy systems. The hardware usually includes sensors and meters that track energy production and consumption, while the software components collect data for analysis. Advanced features often allow users to compare energy usage patterns against solar output, providing a comprehensive view of the system’s efficiency.
In practical terms, real-time data is a game changer for solar energy users. By accessing up-to-the-minute information, users can identify inefficiencies in their systems and implement corrective measures quickly. For example, if a solar panel is underperforming due to shading from trees or dirt accumulation, users can act swiftly to rectify the situation. This immediate feedback loop creates improved system performance retention and ensures a higher energy yield.
2. MOBILE APPLICATIONS
Mobile applications have revolutionized how users interact with solar panel data. Most modern solar energy systems come equipped with companion applications that enable users to monitor their energy production directly from a smartphone or tablet. These applications typically present essential data in a user-friendly format, allowing even non-technical users to interpret their energy consumption, solar generation, and overall system health.
One crucial advantage of mobile applications is their convenience. Users can access their solar data from anywhere at any time, which aids in tracking performance trends and predicting future energy output based on current weather conditions. Additionally, many applications include alerts that notify users of any performance issues or anomalies in real-time, enabling swift responses to potential problems, thus minimizing downtime and maintaining energy efficiency.
3. WEB PORTALS
Web-based portals act as central hubs for accessing solar panel data. These platforms are generally offered by solar providers and serve both residential and commercial clients. Users can log in to these portals to view a treasure trove of information about their solar energy systems, including daily, weekly, and monthly energy generation statistics, efficiency metrics, and financial returns from energy savings.
The incorporation of interactive dashboards within these portals enhances the user experience. A well-designed interface allows users to customize their views, enabling a focused examination of specific data points such as peak production hours and seasonal performance variations. This customization is vital for users who wish to identify patterns in solar energy production over time, which is crucial for making strategic decisions about energy usage and potential system upgrades.
4. DATA ANALYSIS SOFTWARE
Data analysis software models sophisticated methods for processing and interpreting information gathered from solar energy systems. These tools are vital for users looking to glean deeper insights from their solar energy data. The software typically involves advanced analytics that can forecast future energy production based on historical trends, weather forecasts, and geographical factors.
Such analytical capabilities allow users to optimize their energy consumption significantly. For example, businesses might analyze data patterns to determine the most efficient times to consume energy, aligning their usage with peak solar generation periods. This strategy not only enhances operational efficiency but can also contribute to cost savings by reducing reliance on grid electricity during high-demand periods, leading to a secondary layer of financial benefit.
5. ENERGY PRODUCTION AND CONSUMPTION
Understanding the relationship between energy production and consumption is essential for maximizing the benefits of solar panel systems. Users who grasp their energy profiles—how much energy their solar systems produce compared to their consumption—can make informed choices that enhance economic and environmental sustainability.
Data collected from the monitoring systems reveals these patterns clearly, illustrating when solar production peaks and how that aligns with electricity usage habits. By examining this relationship, homeowners and business leaders can implement changes, such as scheduling high-energy activities during peak solar generation hours, ensuring that they capitalize on free solar energy rather than purchasing it from the grid.
FREQUENTLY ASKED QUESTIONS
WHAT TYPE OF DATA CAN I EXPECT FROM SOLAR PANEL MONITORING SYSTEMS?
Solar panel monitoring systems typically provide access to a wide range of data, including energy production rates, cumulative energy output, efficiency ratings, and real-time performance statistics. Users can monitor system health indicators, such as device performance status and any alerts regarding faults or maintenance needs. Data visualization tools help present this information clearly, allowing individuals to observe trends over time. Sophisticated monitoring systems can also correlate energy production with other variables, such as weather conditions and historical performance to predict future output, enabling users to develop informed strategies for energy consumption and management.
HOW OFTEN IS DATA UPDATED IN SOLAR MONITORING SYSTEMS?
The frequency of data updates in solar monitoring systems can vary significantly depending on the technology used. Some systems provide real-time data updates every few seconds, allowing for continuous tracking of solar energy production and consumption. Others may offer data on an hourly or daily basis, depending on the features offered by the provider. Advances in technology have enabled more frequent data updates, improving user access to the latest performance metrics and allowing for timely responses to potential issues. By understanding the update schedule, users can effectively monitor their systems and ensure optimal performance.
CAN I INTEGRATE SOLAR PANEL DATA WITH OTHER HOME ENERGY MANAGEMENT SYSTEMS?
Yes, integrating solar panel data with other home energy management systems is not only possible but often recommended for optimizing overall energy efficiency. By linking solar monitoring data with smart home devices or energy management platforms, users can create a holistic view of their energy consumption across multiple systems. This integration allows for increased automation, enabling users to schedule high-energy activities, monitor real-time usage, and leverage time-of-use electricity rates effectively. Additionally, integrated systems can provide analytics that help users identify energy-saving opportunities and further enhance their solar investment’s performance.
In summary, examining solar panel data encompasses various approaches, including employing monitoring systems, utilizing mobile applications, navigating web portals, and employing data analysis software. With advancements in technology, users have access to detailed insights regarding their solar energy systems. By effectively interpreting this data, individuals can significantly enhance their energy efficiency, lower costs, and optimize their environmental contributions.
Addressing the significance of each method, monitoring systems provide real-time insights essential for diagnosing performance issues. Mobile applications enhance convenience, enabling users to track their systems continuously. Web portals serve as centralized information repositories, fostering deeper insights through interactive dashboards. Data analysis software empowers users with advanced techniques for predicting future energy output, thus facilitating informed decisions regarding energy consumption.
By understanding and leveraging these diverse data viewing options, users can create a more sustainable energy practice, aligning their consumption habits with their solar production. This approach not only aids in maximizing cost savings but also advances their commitment to renewable energy sources and environmental stewardship, proving itself beneficial in the long run.
The insights derived from solar panel data can drive significant improvements in energy management rates, showcasing how informed decisions can effectively transform energy usage. As technology continues to advance, the bond between solar energy systems and data processing will evolve, enabling users to experience enhanced control and increased benefits from their solar investments.
Original article by NenPower, If reposted, please credit the source: https://nenpower.com/blog/how-to-view-solar-panel-data/


