
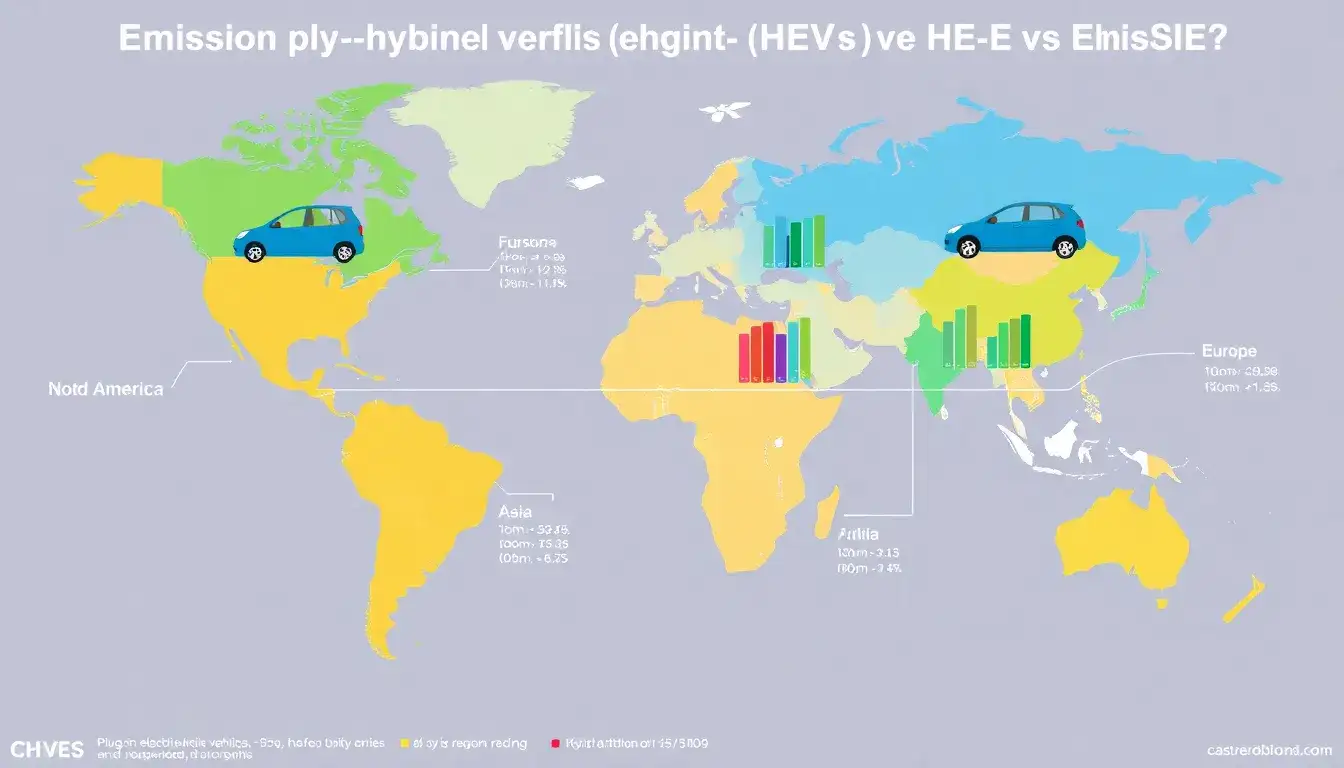
The emissions comparison between Plug-in Hybrid Electric Vehicles (PHEVs) and Hybrid Electric Vehicles (HEVs) varies depending on the region and factors like grid emissions intensity, vehicle use patterns, and emissions from battery production.
Emissions Performance of PHEVs vs HEVs
-
In the United States:
PHEVs reduce lifetime greenhouse gas (GHG) emissions by about 46% compared to internal combustion engine vehicles (ICEVs), slightly outperforming HEVs on average. This improvement is due to PHEVs’ ability to run a significant share of miles on electric power from the grid combined with hybrid technology, despite still using gasoline for about 30% of miles driven. The smaller battery size in PHEVs (roughly one-sixth the size of battery electric vehicles) also means lower embodied emissions from battery production. -
In regions with high grid emissions (e.g., the U.S. Midwest):
PHEVs and HEVs produce roughly similar emissions because the grid electricity used by PHEVs is more carbon-intensive, diminishing their advantage over HEVs that rely more on gasoline-electric hybrid operation. -
Globally:
According to the International Energy Agency (IEA), lifecycle emissions of medium-sized battery electric vehicles (BEVs) are about 30% lower than PHEVs and over 40% lower than HEVs over 15 years. In this global context, PHEVs purchased in 2023 produce around 30% less lifetime emissions than ICEVs, while the gap widens to about 35% by 2035 as electricity grids decarbonize. The emissions advantage of PHEVs over HEVs depends largely on the share of kilometers they travel on electricity (the utility factor), which is often lower in real-world conditions than official tests suggest. -
General emission trends:
Both PHEVs and HEVs produce significantly lower tailpipe emissions than conventional gasoline vehicles due to their electrification, but PHEVs tend to have lower overall emissions when they achieve reasonable electric driving distances, especially in cleaner grid regions.
Summary Table
| Aspect | PHEVs | HEVs | Regional Influence |
|---|---|---|---|
| Battery size/emissions | Smaller battery, lower battery production emissions than BEVs | No large battery; lower battery-related emissions | PHEV advantage reduced with high grid carbon |
| Use phase emissions | Uses grid power ~70% of miles, gasoline ~30% | Primarily gasoline-electric hybrid operation | Cleaner grids favor PHEVs |
| Lifecycle GHG emissions | ~46% reduction vs ICE in US, slightly better than HEVs | Moderate reduction vs ICE, slightly higher than PHEVs | Similar emissions in high-carbon grid areas |
| Global emissions (lifetime) | ~30% lower than ICE in 2023; better with grid decarbonization and higher utility factor | ~40% lower than ICE, but higher than PHEVs and BEVs | Emissions gap influenced by electricity mix |
| Real-world driving factors | Dependent on actual electric driving share (utility factor) | More consistent hybrid operation | Utility factor often lower than official values |
In conclusion, PHEVs generally outperform HEVs in reducing emissions particularly in regions with cleaner electricity grids and when drivers maximize electric mode usage. However, in regions with carbon-intensive grids or low electric driving, PHEVs and HEVs show similar emissions performance. The increasing decarbonization of electrical grids worldwide is expected to improve the emissions advantage of PHEVs over HEVs moving forward.
Original article by NenPower, If reposted, please credit the source: https://nenpower.com/blog/how-do-the-emissions-of-phevs-compare-to-hevs-in-different-regions/
